The Los Angeles Times published an article on June 9 that went into the details of the killings by local law enforcement in Los Angeles County that were ruled a homicide since 2000. It was striking to me how in the last 20 years and after almost 900 deaths, only two officers were charged as a result of shooting a civilian while on duty. The Times shows the trend of deaths over time, highlighted how some communities are disproportionately affected by police violence, map the deaths across the county, and honor those who died by listing each and every one of their names. They discuss and visualize more, and I recommend you check it out.
At the end of the article they mention their source and announce that The Times has released their database of police killings to the public and direct you to its repository on github. Struck by information they presented, I wanted to learn more about those who were killed.
For the following descriptives, I looked at all of the deaths since 2000.
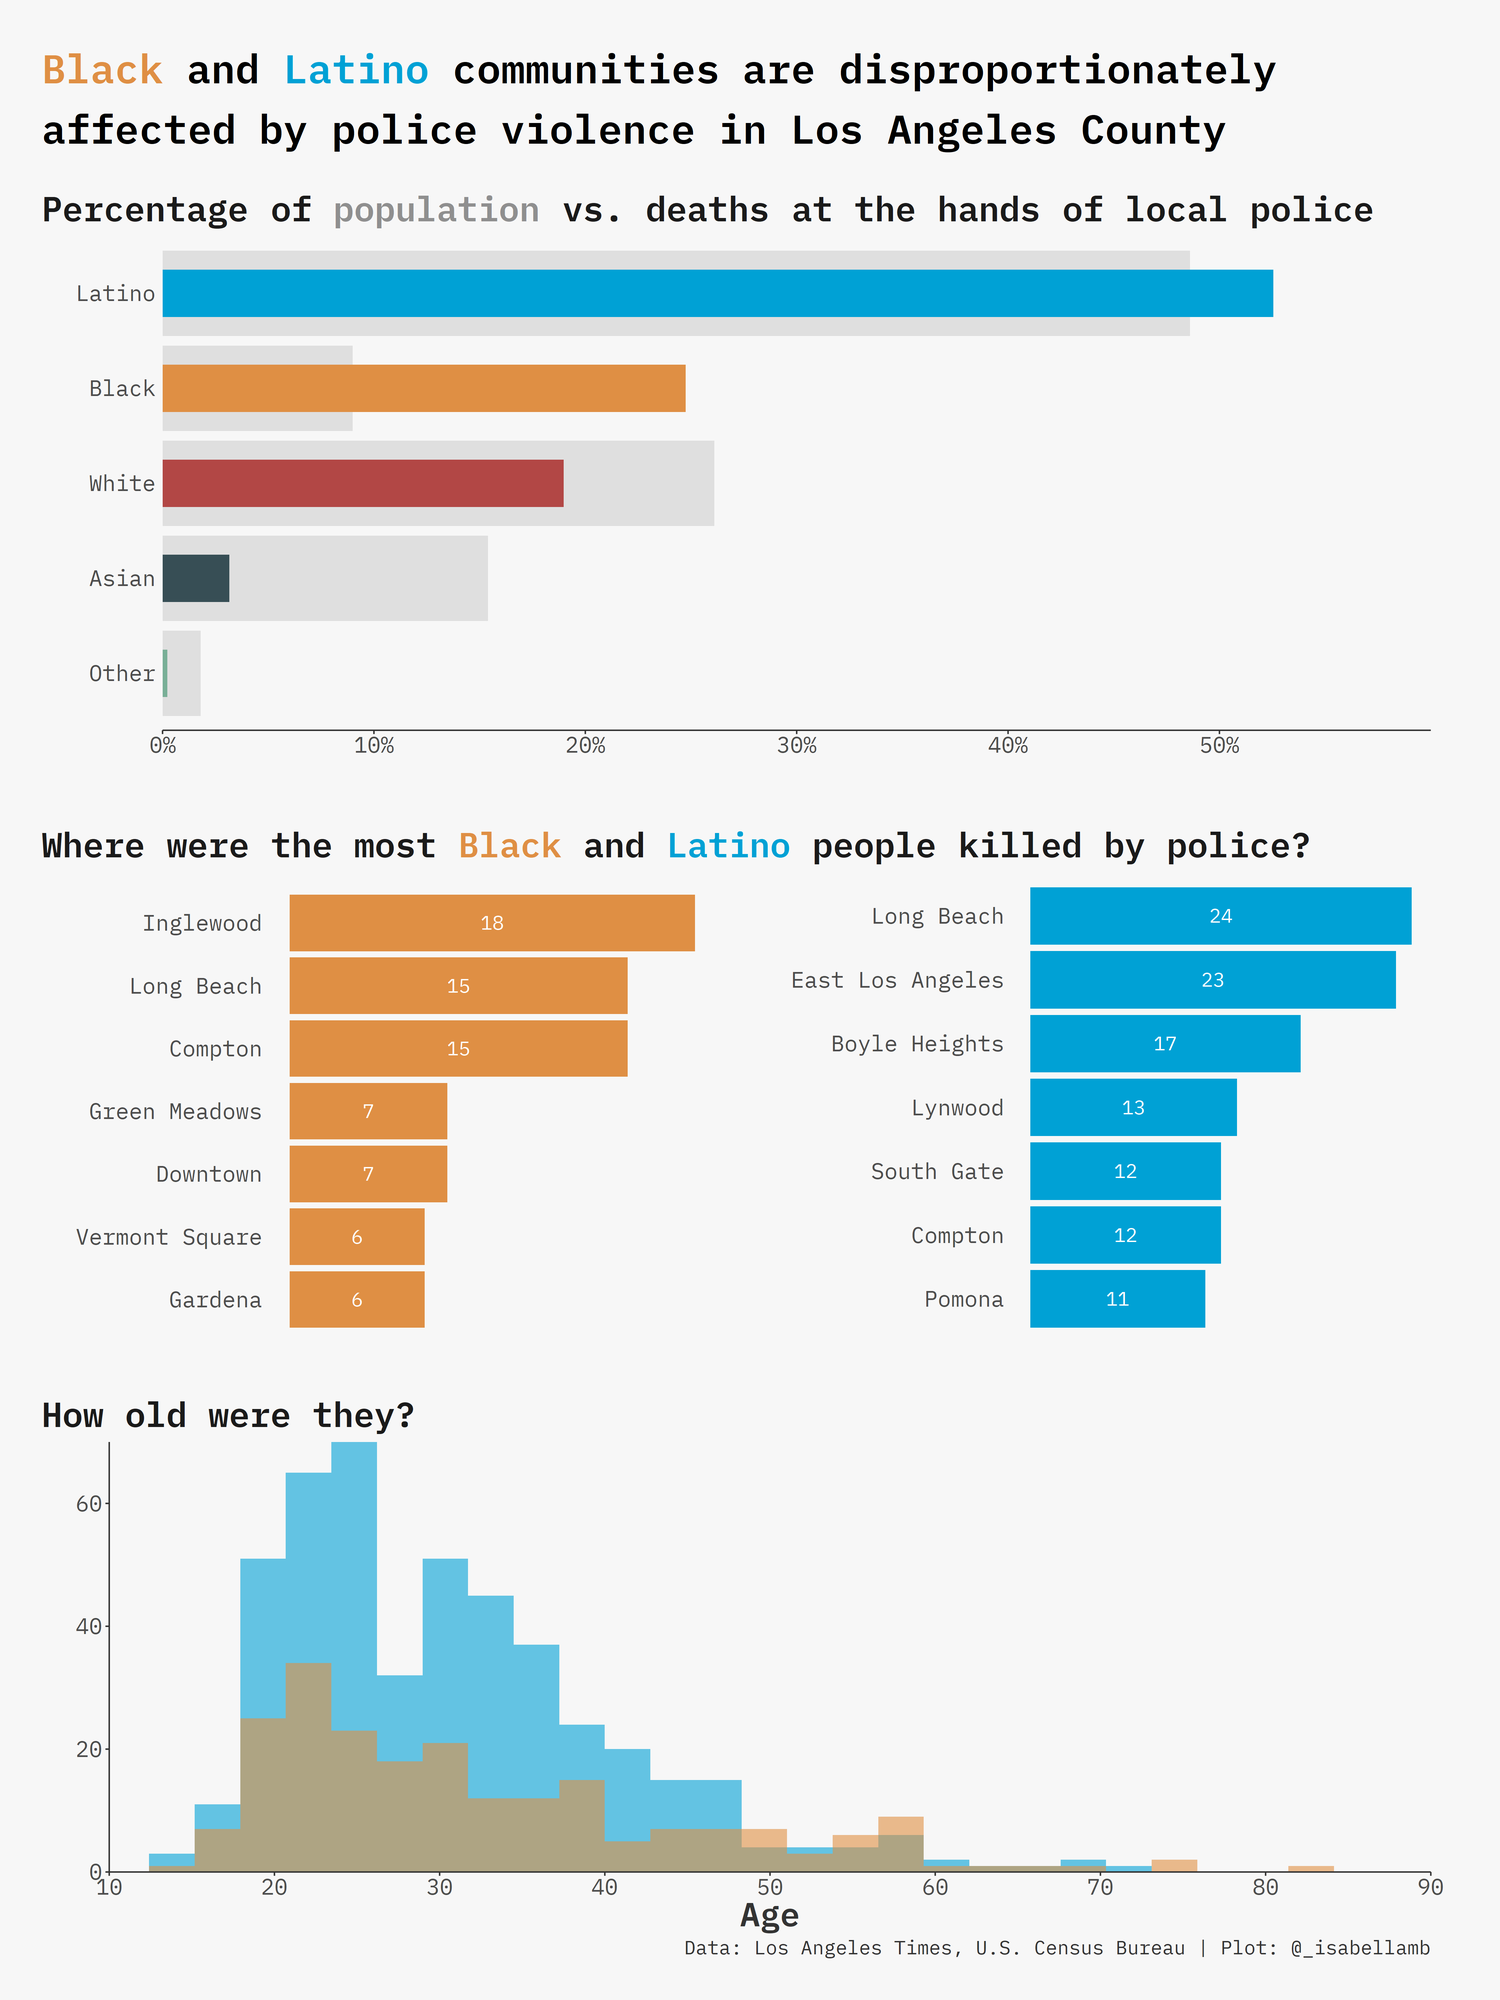
Race
As the L.A. Times mentioned and as you can see in the plot of theirs that I recreated, almost 80% of the people killed were Latino or Black. By comparing the percentages of the populations and deaths we can see how disproportionately they’re affected, particularly the Black community.
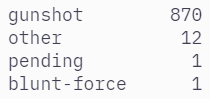
Cause of death
870 (98%) of the 885 deaths were caused by a gunshot.
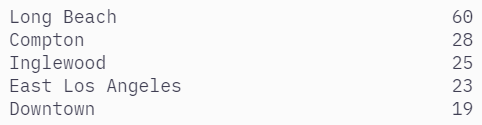
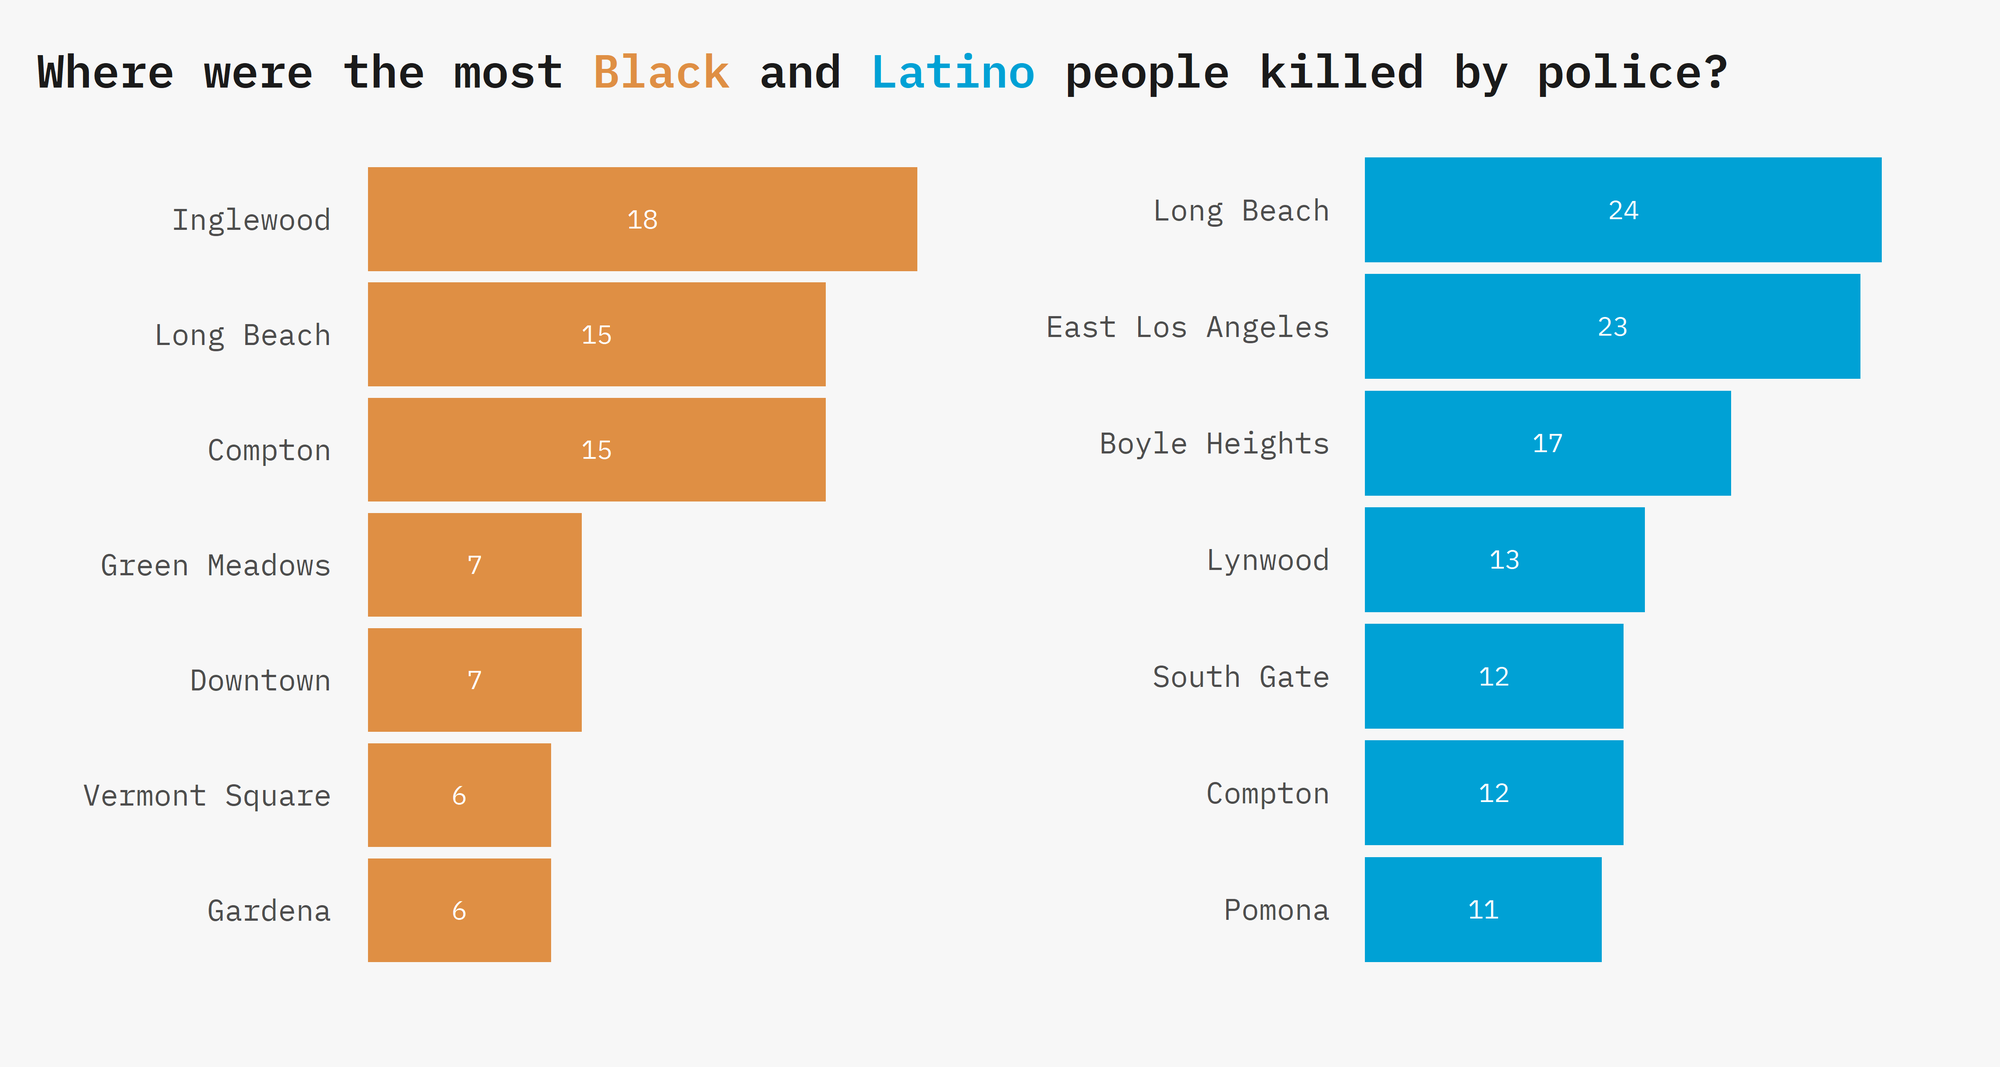
Where the person died
There was an overwhelming amount of people who were killed in Long Beach, with the count being more than double that of Compton, the area with the second most frequent killings.
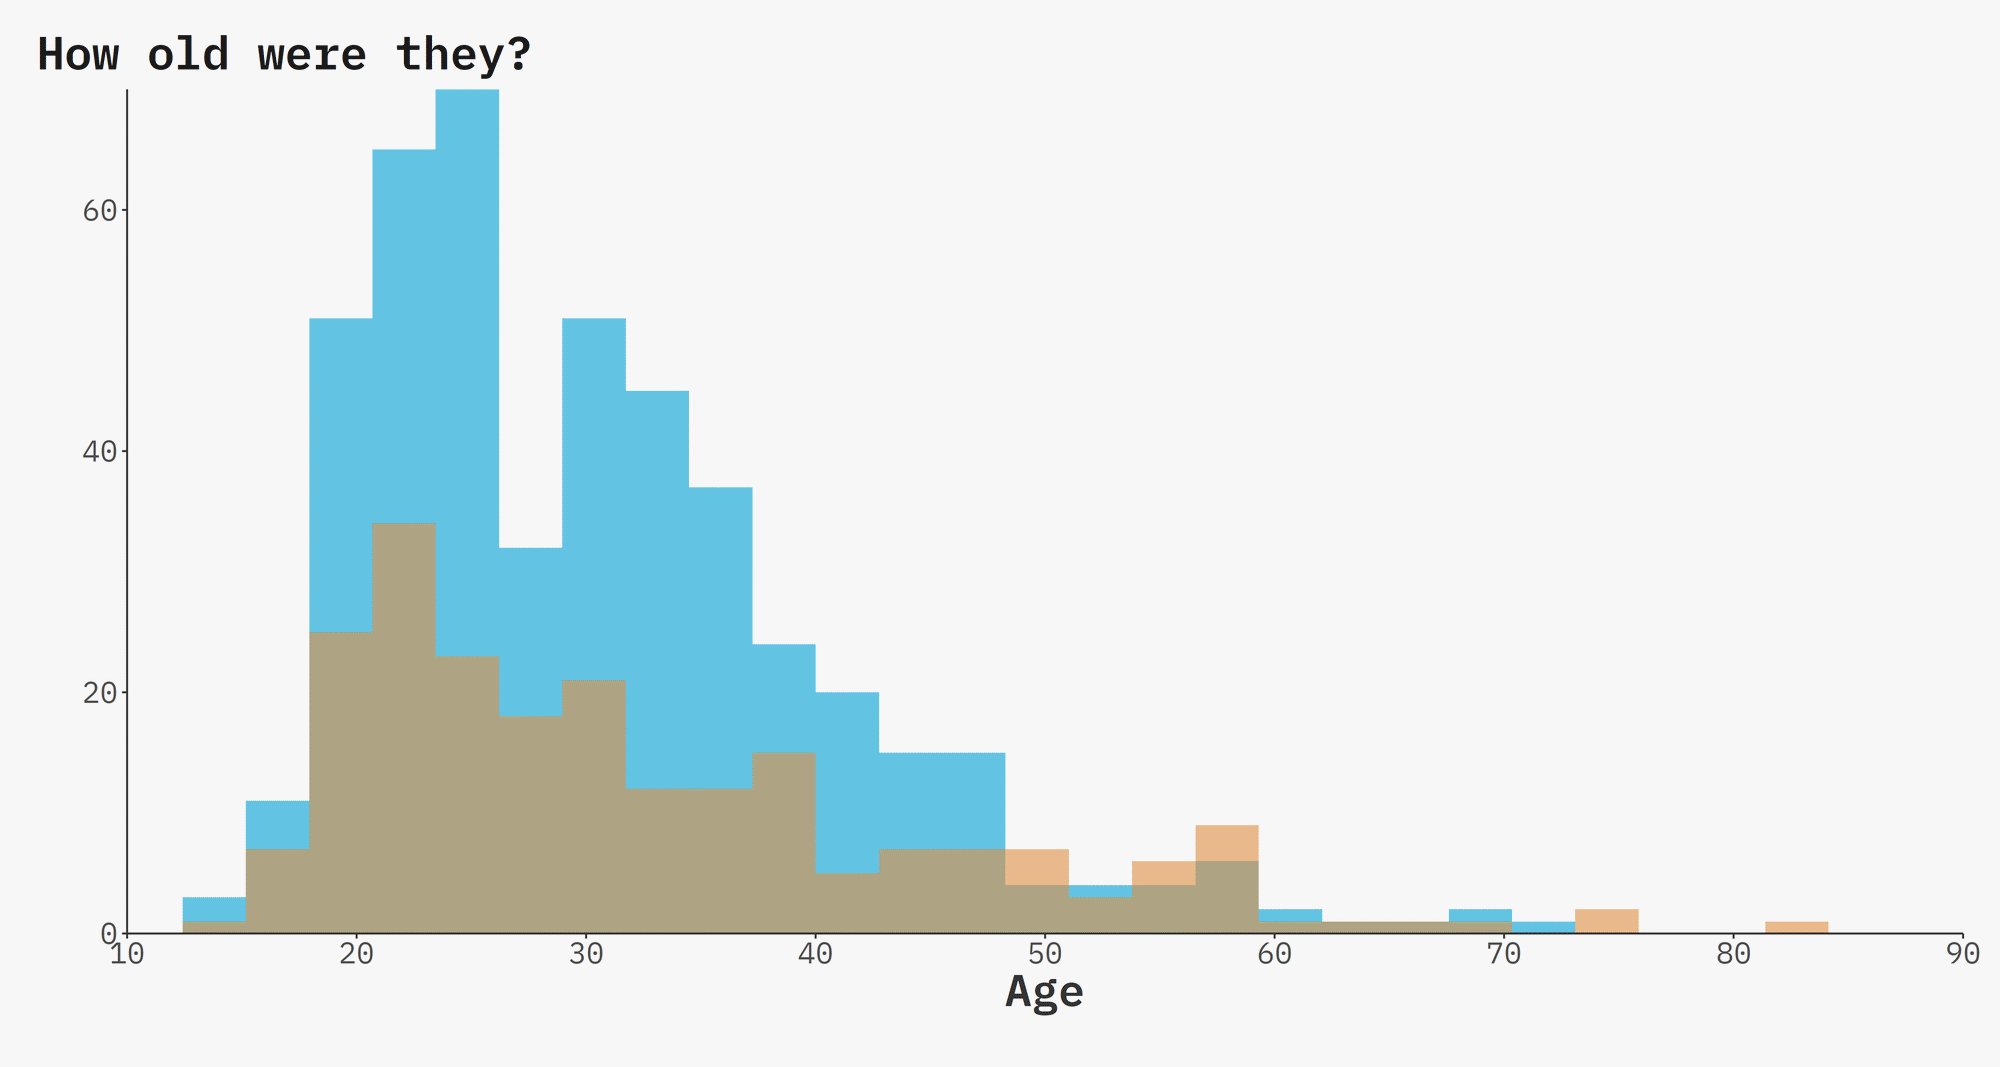
Age at time of death
L.A. Times showed the distribution of the ages of all of those killed by law enforcement, so instead I looked into the ages of those who were Black and Latino. Like the distribution of all people, most of them were in their 20s and 30s.
In addition, I checked to see if there was a pattern in the frequency of the killings by visualizing how many there were per month. There didn’t seem to be one, but I did learn there were only 4 months in those 20 years that no one died at the hands of police.
Full graphic