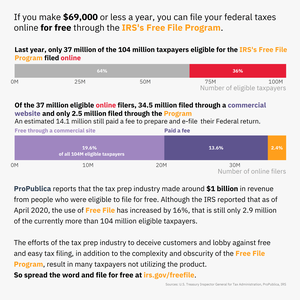
The Tax Prep Industry Sucks
If you or anyone you know makes $69,000 a year or less, stop giving TurboTax and other tax prep companies your money! File for free with the IRS’s Free File Program.
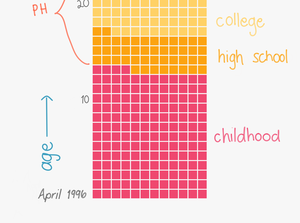
My Life in Months
Visualizing my life (so far) with a waffle chart.
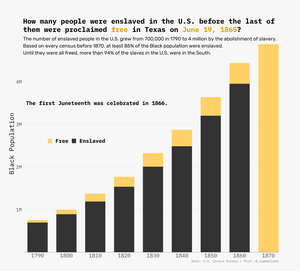
Juneteenth 2020: Taking a look at slavery leading up to its abolishment
Juneteenth is a commemoration of the emancipation of 4 million enslaved African Americans & a celebration of freedom. It’s an important moment in American history.
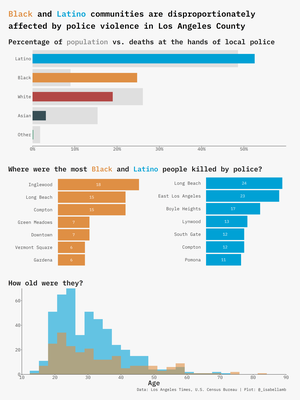
Who is being killed by local police in Los Angeles County?
The Los Angeles Times recently released their database of people who died at the hands of police in L.A. County since 2000. After reading their article about it, I wanted to learn a little more about the two communities affected the most, particularly the Black community.
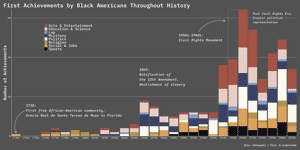
Celebrating Black Americans’ Achievements
✊🏿✊🏾✊🏽 Black Lives Matter. In celebration of Black lives: A visualization of Black Americans breaking the color barrier & achieving firsts in various fields throughout history. I also share some introductory resources to the movement.
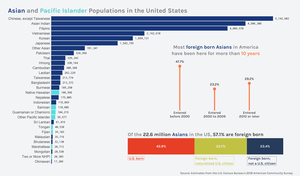
May is Asian and Pacific Islander American Heritage Month ✨
Read more about it in this New York Times article: Why the Fastest Growing Population in America Is The Least Likely to Fill Out the Census
IMDb ratings of all 110 Community (2009 - 2015) episodes
First of all, Community is a gem and if you haven’t seen it, you should.
On May 9, 2020 I scraped the IMDb ratings of all 110 Community episodes in honor of their May 18, 2020 reunion to raise money for two coronavirus relief efforts.

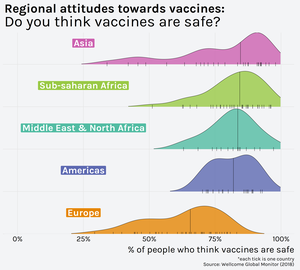
Improving a bad visualization
Recreation of a visualization originally published by Wellcome Global Monitor in 2018.
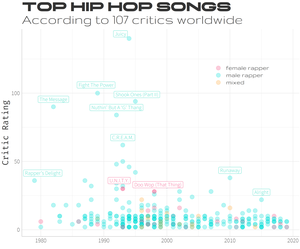
What are the “best” hip hop songs?
Tidy Tuesday’s Week 16 dataset from BBC Music
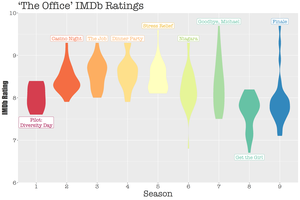
Looking at The Office’s IMDb Ratings and Writers
Tidy Tuesday’s Week 12 dataset from the
schrute R package and data.world