Bar Plots in `Bokeh` & How to Embed Them
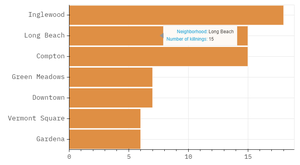
Creating my first simple
bokeh bar plot– an interactive version of my plot of the neighborhoods where law enforcement in L.A. County killed the most Black people.
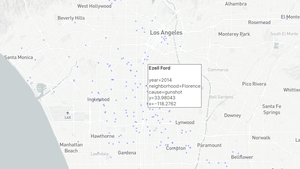
Scatter Plots on Mapbox with `plotly` Express in Python & How to Embed Them
Creating my first interactive map with Mapbox to show where each Black person who was killed by police in L.A. County died.
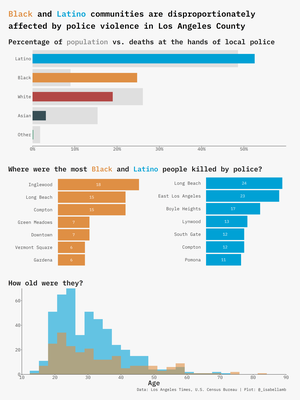
Who is being killed by local police in Los Angeles County?
The Los Angeles Times recently released their database of people who died at the hands of police in L.A. County since 2000. After reading their article about it, I wanted to learn a little more about the two communities affected the most, particularly the Black community.