{ib} - My First R Package
I’ve been busy and haven’t been able to code in R for around 3 weeks now, and as my first project back, I decided to do something I’ve been wanting/planning to do for a while now: make a personal R package.
Background
Originally, I had intended to create a themes package called ibthemes for myself to speed up my plotting process both when doing EDA (viewing plots in the plots pane) and creating visualizations that I’ll be saving. While writing the functions I instead decided to rename the package to ib and change its purpose from a plotting package to a general package containng functions for my personal use, since I realized I’ll probably be creating more non-ggplot2 functions at some point in time and would want them all in one place.
Functions
As of now, it only contains 6 functions, all for use when creating plots with ggplot2:
-
theme_ib: A simpleggplot2theme in my personal style. By default (plots_pane = FALSE), the theme adjusts the text sizes for printing images with width 10+ inches & height 8+ inches.plots_pane = TRUEis meant to be used when viewing plots in the plots pane and text sizes are not adjusted. There is also an option (md = TRUE) to use markdown theme elements fromggtextinstead ofelement_text(). The fonts used are IBM Plex Sans & IBM Plex Mono, to load them you needextrafontand to runextrafont::loadfonts(device = "win", quiet = TRUE)if you’re using Windows. -
update_geom_fonts_ib: Update font defaults for text geoms to matchtheme_ib -
scale_x_c_ib: Sets default values for theexpandargument ofscale_x_continuousthat adds 0.5 units of space on both sides of the plot -
scale_x_d_ib: Sets default values for theexpandargument ofscale_x_discretethat adds 0.5 units of space on both sides of the plot -
scale_y_c_ib: Sets default values for theexpandargument ofscale_y_continuoussuch that there is no space below the lowest value and the top end of the plot is extended by 5% (eg. for use with bar plots) -
scale_y_d_ib: Sets default values for theexpandargument ofscale_y_discretesuch that there is no space below the lowest value and the top end of the plot is extended by 5% (eg. for use with bar plots)
Examples
The following plots were taken from
Allison Horst‘s palmerpenguins
README.
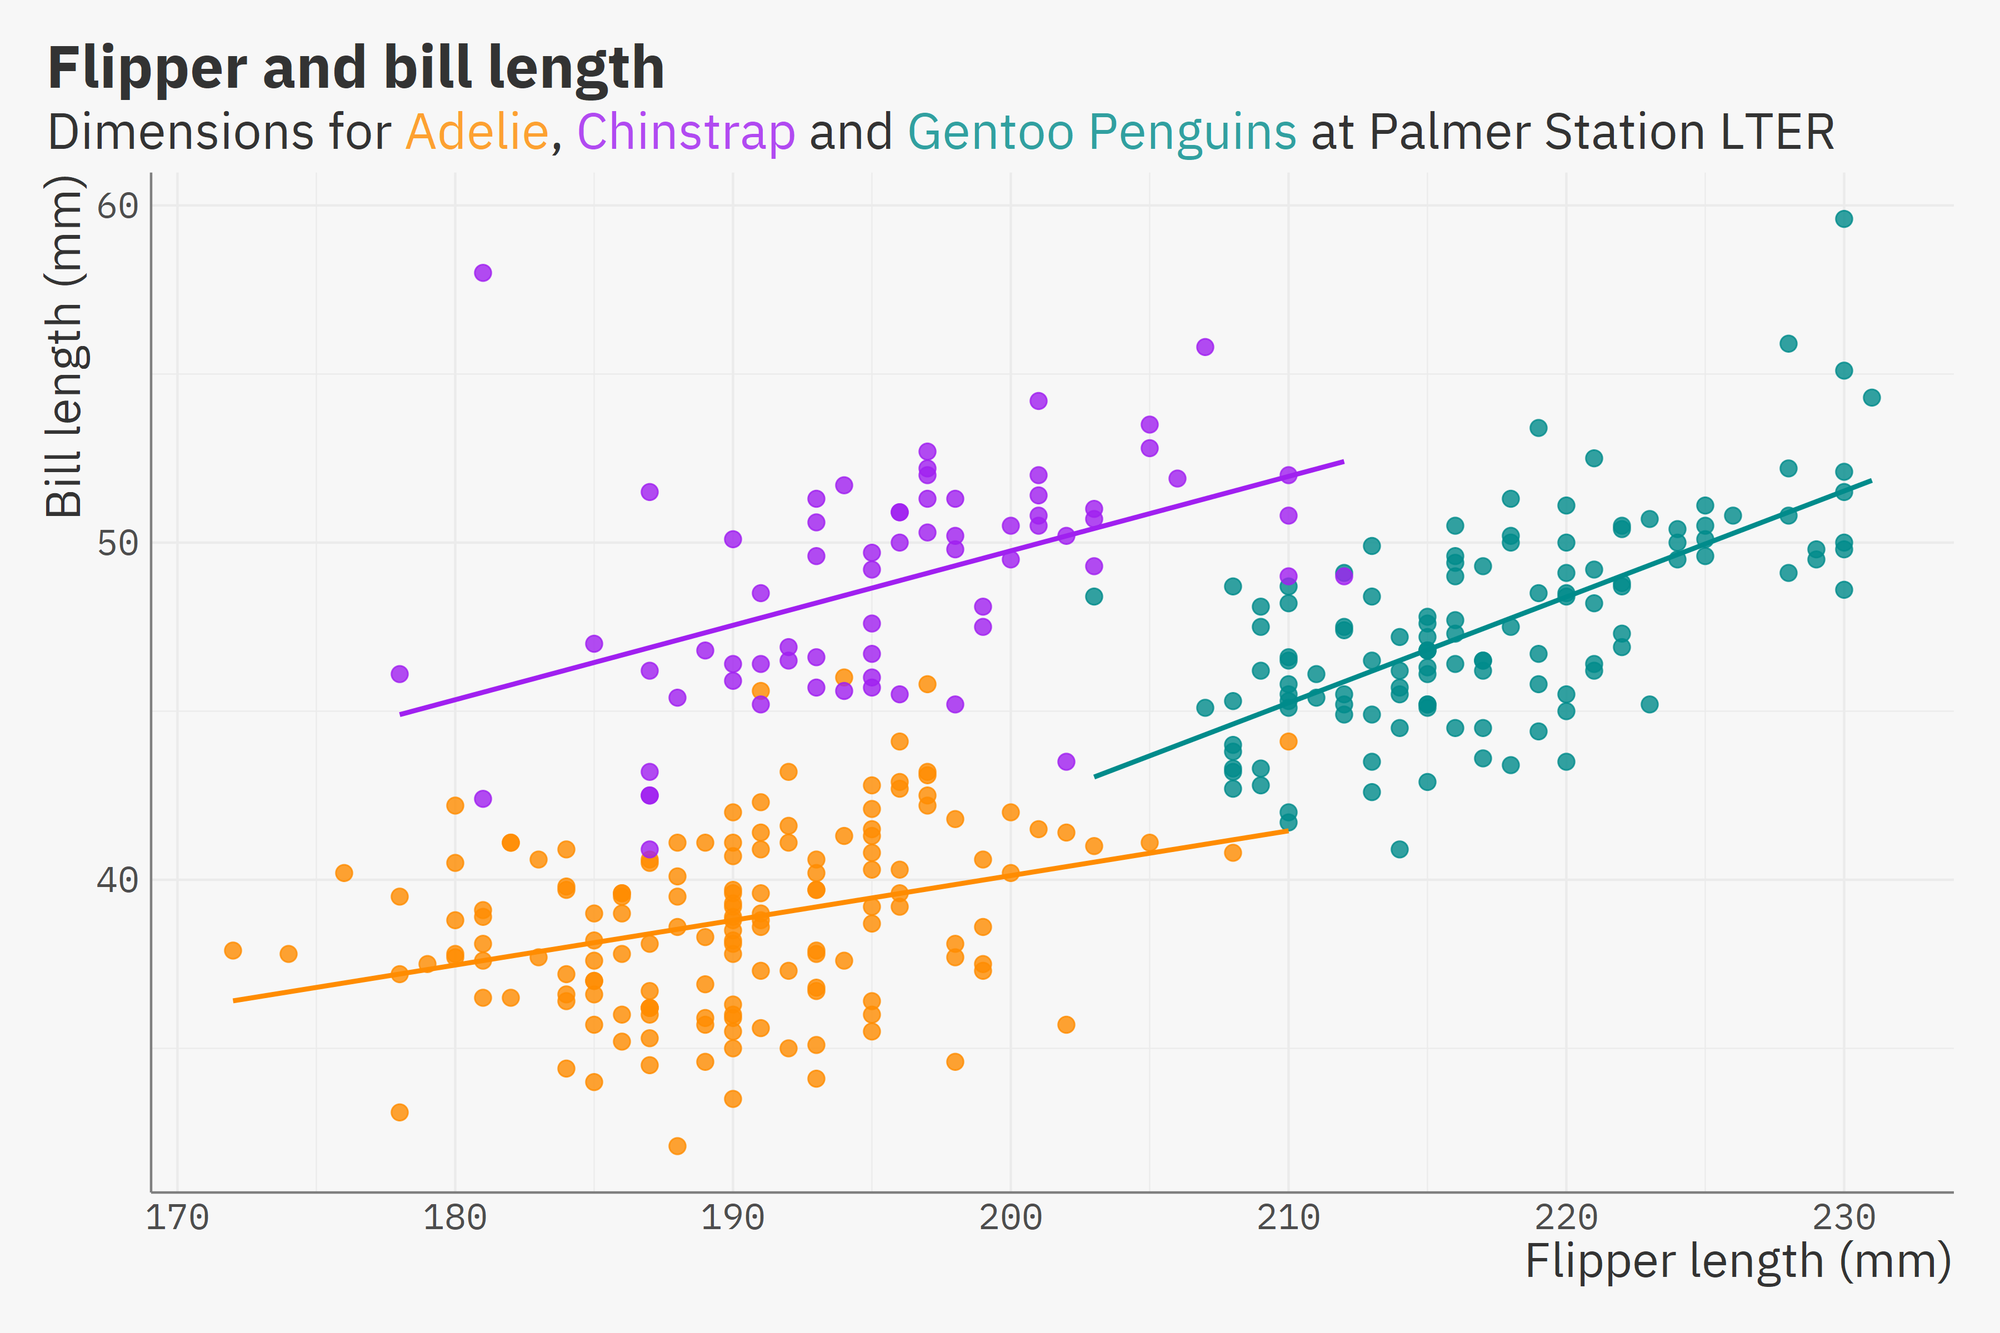
Using theme_ib to print a scatter plot with width = 12 inches & height = 8 inches and the md = TRUE argument to use
ggtext::element_markdown() instead of
element_text() for text elements, in this case the subtitle:
library(ggplot2)
library(palmerpenguins)
library(ib)
extrafont::loadfonts(device = "win", quiet = TRUE) ## to load the font

ggplot(data = penguins,
       aes(x = flipper_length_mm,
           y = bill_length_mm)) +
  geom_point(aes(color = species),
             size = 3,
             alpha = 0.8, show.legend = FALSE) +
  geom_smooth(method = "lm", se = FALSE, aes(color = species), show.legend = FALSE) +
  scale_color_manual(values = c("darkorange","purple","cyan4")) +
  labs(title = "Flipper and bill length",
       subtitle = "Dimensions for <span style = 'color:#FDA131;'>Adelie</span>, <span style = 'color:#B14AF1;'>Chinstrap</span> and <span style = 'color:#31A0A0;'>Gentoo Penguins</span> at Palmer Station LTER",
       x = "Flipper length (mm)",
       y = "Bill length (mm)",
       color = "Penguin species") +
  theme_ib(md = TRUE) +
  ggsave("flipper_bill.png",device = "png", type = "cairo", width = 12, height = 8, dpi = 300)
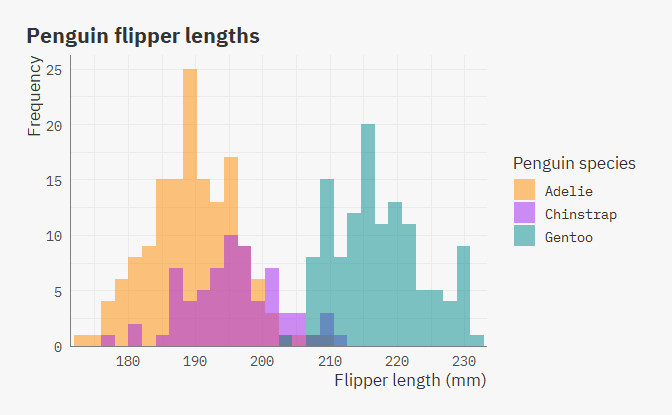
Using the plots_pane = TRUE argument in theme_ib, and adjusting the scales using scale_x_c_ib & scale_y_c_ib:
ggplot(data = penguins, aes(x = flipper_length_mm)) +
  geom_histogram(aes(fill = species),
                 alpha = 0.5,
                 position = "identity") +
  scale_fill_manual(values = c("darkorange","purple","cyan4")) +
  labs(title = "Penguin flipper lengths",
       x = "Flipper length (mm)",
       y = "Frequency",
       fill = "Penguin species") +
  theme_ib(plots_pane = TRUE) +
  scale_x_c_ib() +
  scale_y_c_ib()