isabella
about
blog
today i learned
mapbox
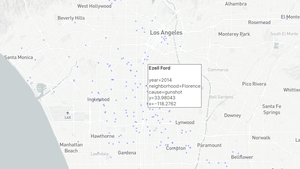
Scatter Plots on Mapbox with `plotly` Express in Python & How to Embed Them
Creating my first interactive map with Mapbox to show where each Black person who was
killed by police in L.A. County
died.
Jun 15, 2020
100DaysOfCode
,
python
,
tutorial
,
mapbox
,
plotly
Cite
×