How to Make an R Package
For future reference: a compilation of the resources I used to create my first R package
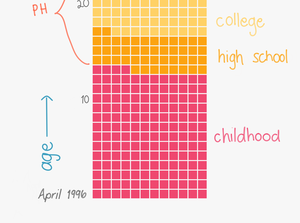
My Life in Months
Visualizing my life (so far) with a waffle chart.
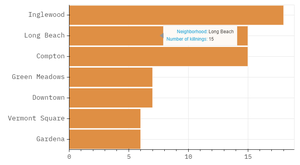
Bar Plots in `Bokeh` & How to Embed Them
Creating my first simple
bokeh bar plot– an interactive version of my plot of the neighborhoods where law enforcement in L.A. County killed the most Black people.
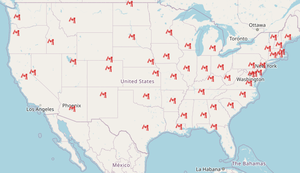
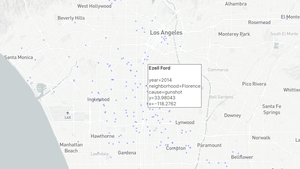
Scatter Plots on Mapbox with `plotly` Express in Python & How to Embed Them
Creating my first interactive map with Mapbox to show where each Black person who was killed by police in L.A. County died.
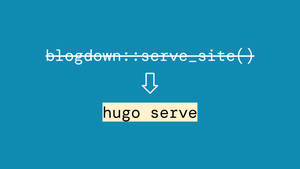
Switching to `hugo serve` instead of `blogdown::serve_site()`
Should have done it sooner, it’s so much faster.
APIs & Interactive Maps with Leaflet in R
Requesting and mapping the International Space Station❜s pass times over U.S. state capitals.